How much is in it?
Quantify every component of a mixture, with an uncertainty you can put in a batch record.
Glucose4.31 g/L
Lactate1.92 g/L
Glutamine0.84 g/L
Ammonium0.21 g/L

Show Lythein five labelled Raman spectra. It identifies substances, measures concentrations and flags what it has never seen, each with a confidence score, through one API call.
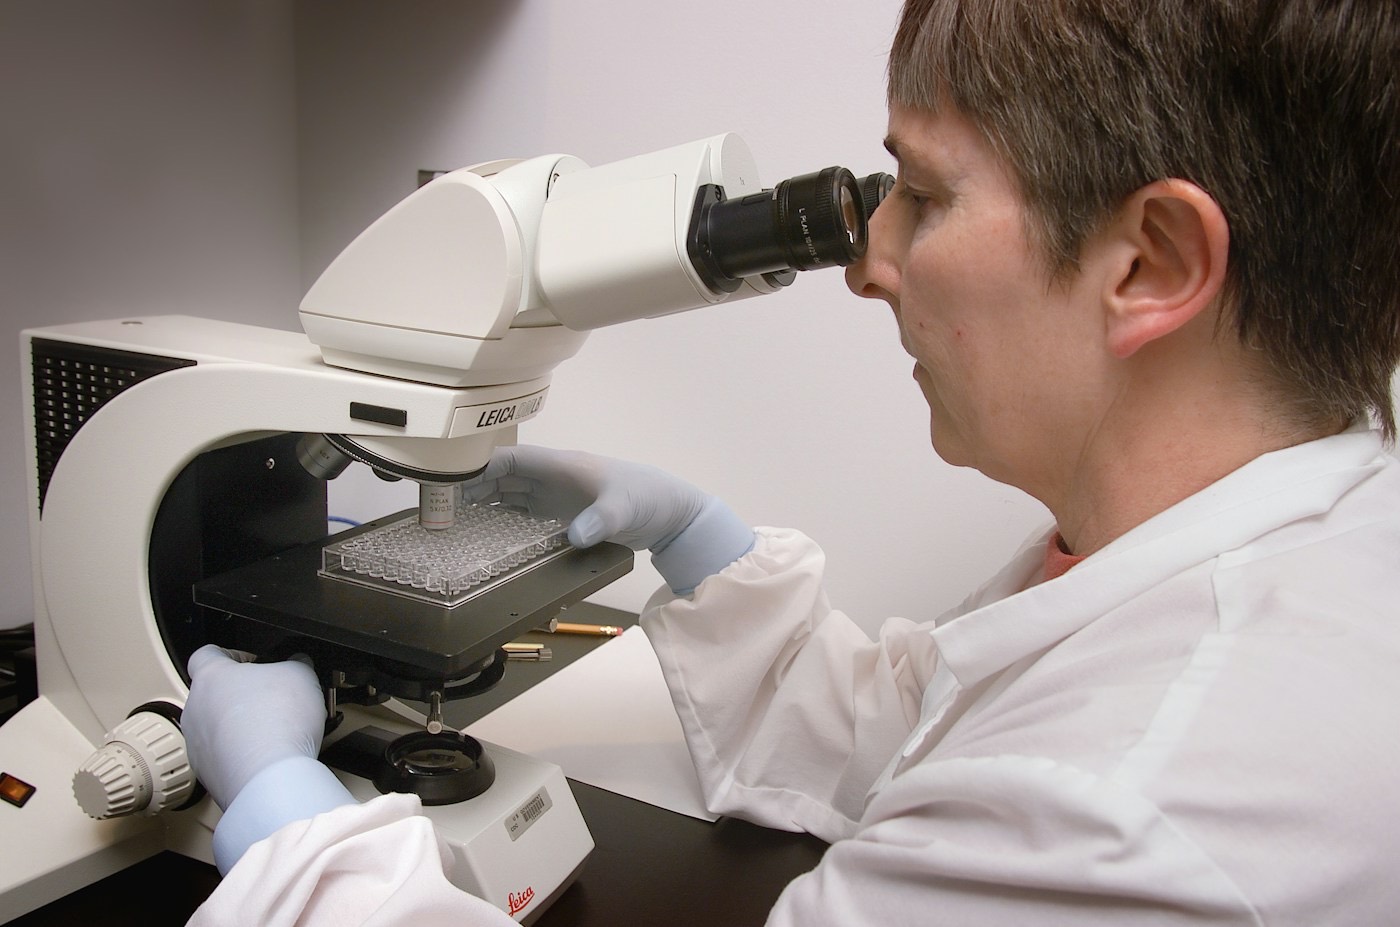


Also for instrument makers who want a model inside their software.
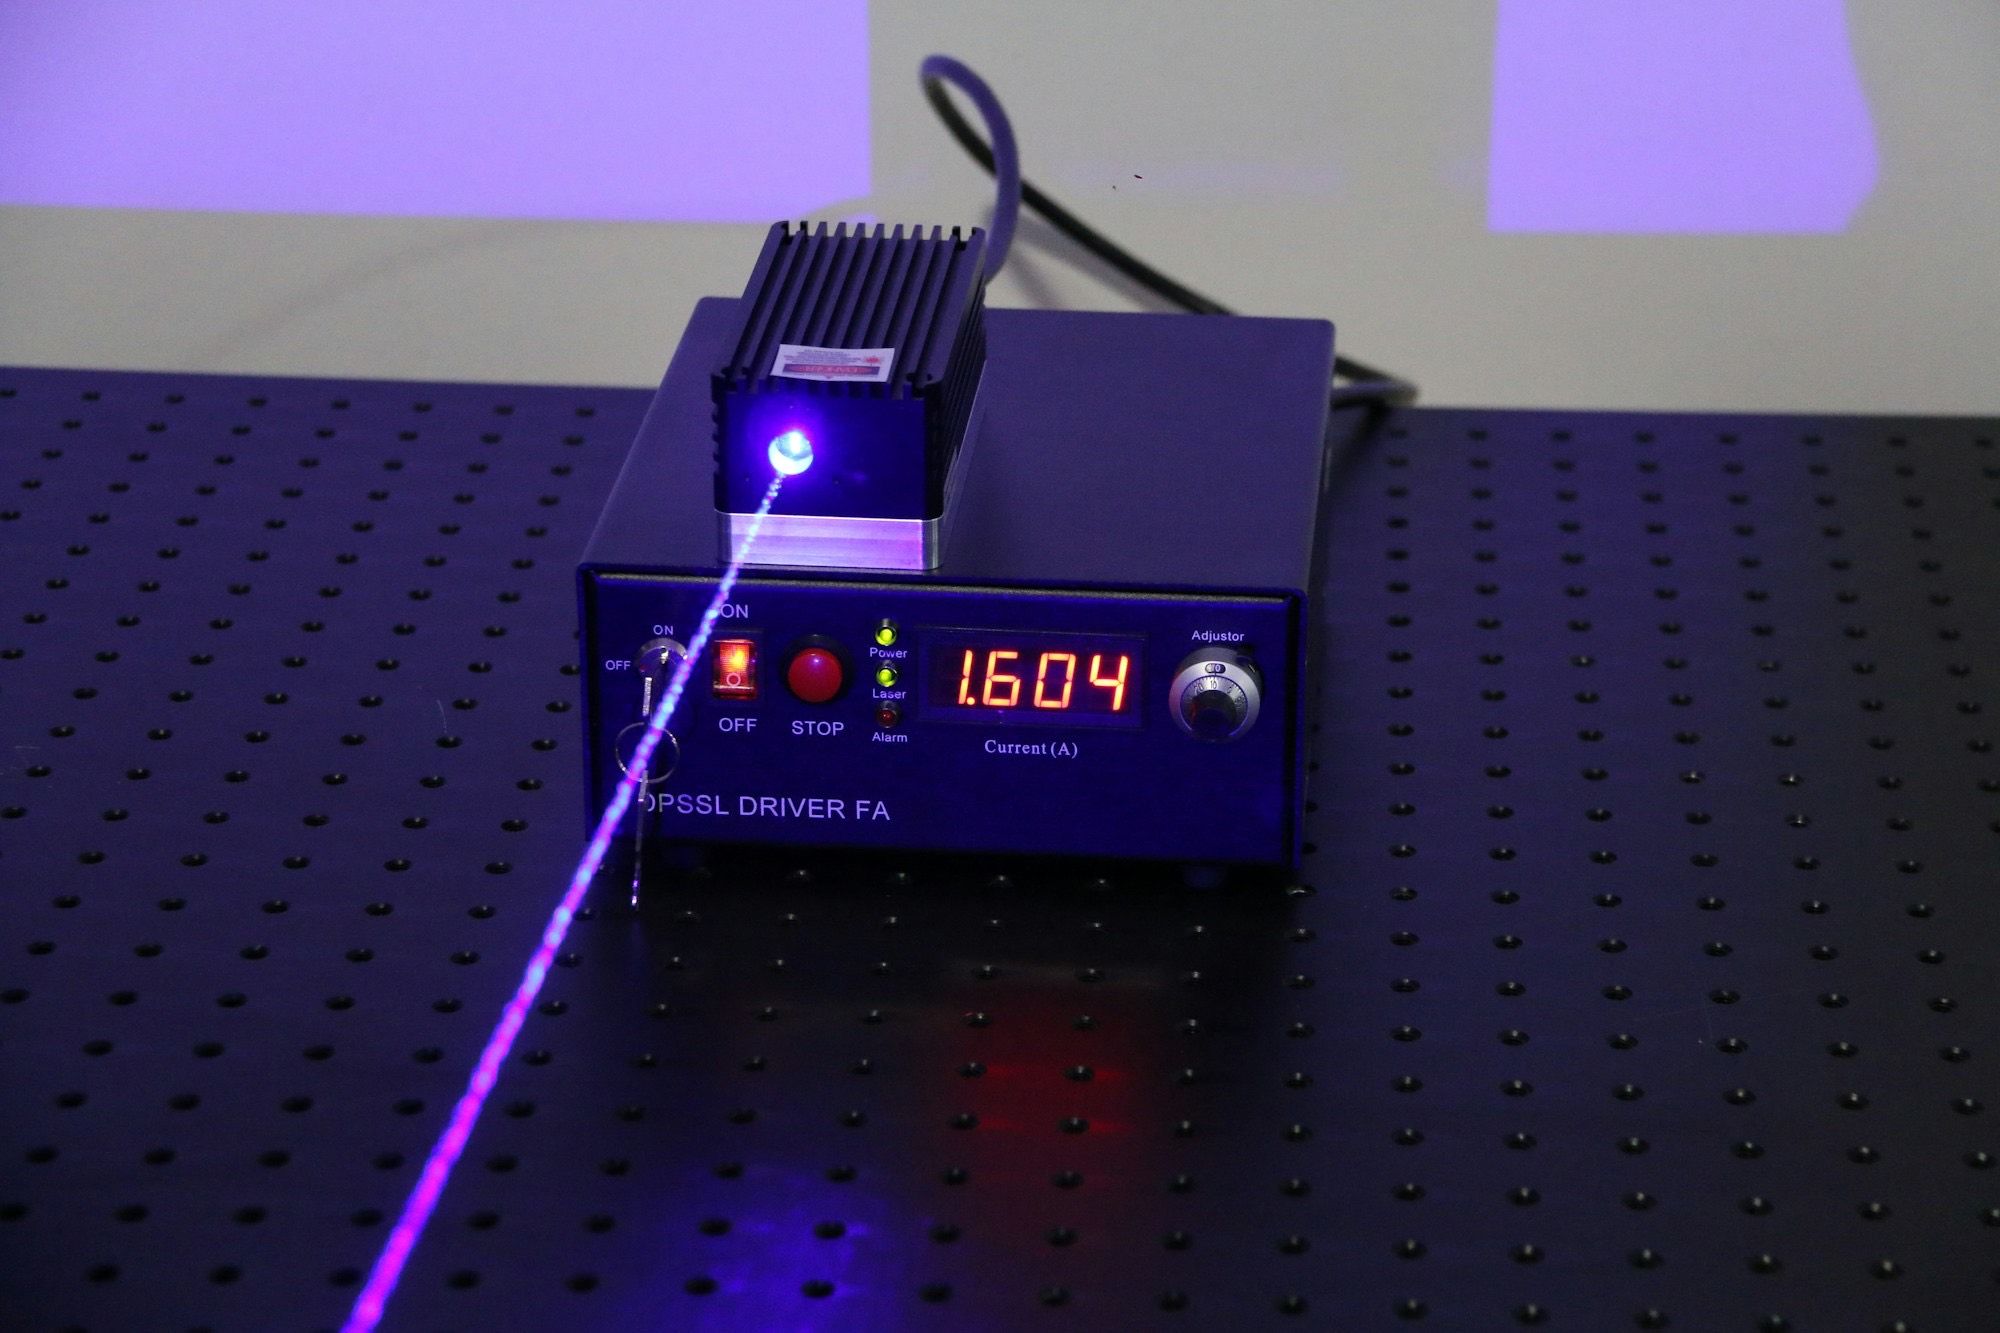
A laser meets the sample. About one photon in ten million comes back shifted by the molecule’s vibrations. That faint shift is a fingerprint, and Lythein reads it.
In 1860, two blue lines in a flask of mineral water revealed an element no one had ever held. Caesium was the first discovery made by reading light alone. Our first model does the same for every sample you measure.
caesium-1Chemometric models are rebuilt for every product, instrument and site. Lythein already understands spectra, so it needs only a few examples of yours.
Send a handful of labelled spectra from your own instrument: reference standards, or samples you already know.
The model calibrates to your device, laser and background in context. No training run, no data scientist, no weeks of collection.
Every new spectrum comes back with its components, concentrations, confidence and anything that doesn't belong.
Quantify every component of a mixture, with an uncertainty you can put in a batch record.
Match against your library or ours, even through fluorescence and noise.
When something doesn't belong, Lythein says so instead of guessing. Contaminants surface before they ship.
Calibrated scores tell you when to trust a result and when to send the sample to the lab. Low confidence goes to a person, not into a report.
Real labelled spectra are scarce and locked inside companies. So we simulate them: every peak, background and artefact a real instrument produces, with the right answer attached.
Send a spectrum in any format your instrument exports. Get structured results back in about a second.
from lythein import Lythein

client = Lythein()

# Five labelled spectra calibrate the model to your instrument
ctx = client.contexts.create(
    examples=["std_01.spc", "std_02.spc", "std_03.spc",
              "std_04.spc", "std_05.spc"],
)

result = client.analyze(
    "tablet-batch-0412.spc",
    model="caesium-1",
    context=ctx.id,
)

for c in result.components:
    print(c.name, c.concentration, c.confidence)
if result.unknowns:
    print("Flagged:", result.unknowns)
curl https://api.lythein.com/v1/analyze \
  -H "Authorization: Bearer $LYTHEIN_API_KEY" \
  -F spectrum=@tablet-batch-0412.spc \
  -F model=caesium-1 \
  -F context=ctx_8f2a
{
"components": [
{ "name": "Ibuprofen", "concentration": 61.8, "unit": "% w/w", "confidence": 0.99 },
{ "name": "Microcrystalline cellulose", "concentration": 29.4, "confidence": 0.97 },
{ "name": "Lactose monohydrate", "concentration": 8.1, "confidence": 0.94 }
],
"unknowns": [
{ "shift_cm1": 1086, "note": "not in context or library" }
],
"model": "caesium-1"
}We train on simulation and test on measurement. Caesium's results will be submitted to RamanBench, the open benchmark of real-world Raman data.
Figures from RamanBench (Koddenbrock, Rodner et al., NeurIPS 2026). We are not affiliated with its authors.
Every instrument speaks physics. Each model is named for an element first found by reading its light.
Identify, quantify, flag.
The other half of vibrational spectroscopy.
Crystal phases from patterns.
And whatever measures matter next.
In 1860 Bunsen and Kirchhoff saw two blue lines in the spectrum of mineral water that matched nothing known. It was the first element ever discovered by spectroscopy, named from the Latin caesius, sky blue. Our models are named for elements found by reading light, and Caesium comes first.
Usually five to ten labelled spectra per new product or instrument. Because the model has already learned how Raman spectra behave from simulation, your examples only have to show it what's specific to your setup.
We generate training spectra from the physics of Raman scattering: peak shapes, mixtures, fluorescence, instrument response, noise and spikes. Every simulated spectrum comes with its exact composition, so the model learns from perfect labels at a scale no lab could measure.
No. Your spectra calibrate the model in context for your account only, and are never used to train shared models.
Any dispersive or FT Raman instrument. Send SPC, JCAMP-DX, CSV or raw arrays; we handle axis calibration and resampling.
Yes, for regulated environments and instrument makers who want the model inside their own software. Talk to us.